Visualizations with rvispack
Contents
Visualizations with rvispack#
rvispack is obsolete, see rugplot: ReUsable Graphics instead.
Assumptions#
Docker or Singularity are installed.
Docker#
The command
docker run --rm venustiano/cds:rvispack-0.1.0
will download the Docker image venustiano/cds:rvispack-0.1.0 from DockerHub if it is not in the computer host. Then it will run a container and display information about the R packages used to implement the visualizations. The Index section displays the current implemented functions:
Index:

c_histogram             Histogram
c_pcaproj               PCA projection
c_violin                Violin plots
The c_ prefix in the function name stands for containerized and receives a JSON file name as a parameter. This file must contain information such as the data file, the parameters of the visualization technique and the output formats. Finally, the container will stop running and the –rm flag will remove it.
Help#
The required name/value pairs in the JSON file can be displayed by adding <c_function_name> help in the previous command, as follows:
docker run --rm venustiano/cds:rvispack-0.1.0 c_pcaproj help
A brief description of the name/value pairs that could be in the JSON file are displayed in the Arguments section:
Arguments:

    lp: a list of parameters created using the `validate_json_file`
        function

        "filename": <string, required data file including more than 3
        columns>

        "variables": <array, numeric columns for applying PCA>

        "colour": <string, categorical variable to colour the
        projected points>

        "scale": <boolean, required whether to scale the selected
        variables>

        "biplot": <boolean, Display biplot (loadings)>

        "title": <string, title of the plot>

        "caption": <string, caption of the plot>

        "save": <object, composed of 'save', 'height', 'width' and
        'device'>

        "save": <boolean, whether to save the visualization or not>

        "height": <number, in cm of the output visualization file>

        "width": <number, in cm of the output visualization file>

        "device": <enum, ["eps", "ps", "tex", "pdf", "jpeg", "tiff",
        "png", "bmp", "svg"]>

        "interactive": <boolean, save
        interactive html version>
The names in the JSON file are between double quotes and the description of the values are between angle brackets. This description includes the data types as defined in the JSON format. Below is an example of a valid JSON file (pca_iris_params.json):
{
    "filename": "iris.csv",
    "colour": "species",
    "scale": true,
    "biplot": true,
    "title": "Iris PCA projection"
}
JSON objects and name/value pairs#
A JSON object is an unordered set of name/value pairs. An object begins with { left brace and ends with } right brace. Each name is followed by : colon and the name/value pairs are separated by , comma.
Name/value pairs in the JSON objects are validated by means of JSON schemas. Here will be described the essential name/value pairs to run the functions to create visualizations using rvispack. See the JSON Schema Reference for additional information.
The description of the values (between<>) indicate the type of value, namely string, number, integer, object, array and boolean.
The “string” type is used for strings of text.
The number type is used for integers or floating point numbers.
The integer type is used for integran numbers (no decimal point).
The boolean type matches only true or false.
The array type is used for ordered elements.
The enum keyword is used to restrict a value to a fixed set of values defined in an array.
The object type is used to map “names” to “values”. “names” must always be strings. In the arguments of the c_pcaproj function, “save” is a nested JSON object including 4 name/value pairs. As an example, the JSON save object can be defined as follows:
...
"save":{
    "save": true,
    "width": 15,
    "height": 10,
    "device": "png"
  }
}
Volumes#
For the visualization functions to access the data and the JSON file, a folder in the filesystem must be mounted in the container. A common way to achieve this is by passing an argument like -v “$PWD”:/app/data in the command as follows:
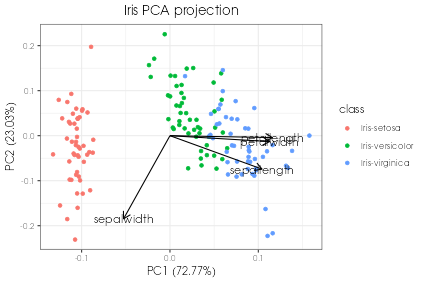
docker run --rm -v "$PWD":/app/data venustiano/cds:rvispack-0.1.0 c_pcaproj pca_iris_params.json
-v is just an abbreviation of –volume. The content of the working directory ($PWD) including the JSON and data files will be available in the container in the folder /app/data.
Note
Under Windows if not using WSL, preferably use Powershell and change “$PWD” by ${PWD}.
Warning
Do not change the /app/data mounting point.
The result of running the previous command is the following visualization stored in a Rplot.pdf file.

Setting “interactive” to true in pca_iris_params.json will generate an interactive visualization:
...
     "title": "Iris PCA projection",
     "interative":true
 }
Singularity#
Todo
Write documentation for running rvispack visualizations using singularity.