GeneNetTools
Contents
GeneNetTools#
Note
This documentation is still a work in progress.

The GeneNetTools container implements the statistical techniques
developed in Bernal et al. [BSAB+22]. These implementations allow not
only to reproduce some of the results in the paper but also
reuse the functions with your own data without the need for
programming skills. It is assumed that you have Docker installed.
Reproducible results#
For the time being, two figures can be reproduced with the
GeneNetTools container Figure 2 (b) and Figure 3.
Figure 2 (b). Partial correlations plot#
Save the following JSON object in an
shrunk.jsonfile{ "filename":"https://raw.githubusercontent.com/V-Bernal/GeneNetTools/venus/feature/container/GeneNetTools/tests/testthat/data/ecoli.csv", "verbose": true, "cutoff": 0.01 }
or download the file running the command:
wget https://raw.githubusercontent.com/V-Bernal/GeneNetTools/venus/feature/container/GeneNetTools/tests/testthat/params/shrunk.json
Run the command
docker run --rm -v "$PWD":/app/data venustiano/cds:genenettools-0.1.0 c_pcor_shrunk shrunk.json
Results
Opening  parameters file: shrunk.json
Reading all columns
Number of samples =  9
Number of variables =  102
degrees of freedom k = 828.949258958985
and the plot in
Rplots.pdf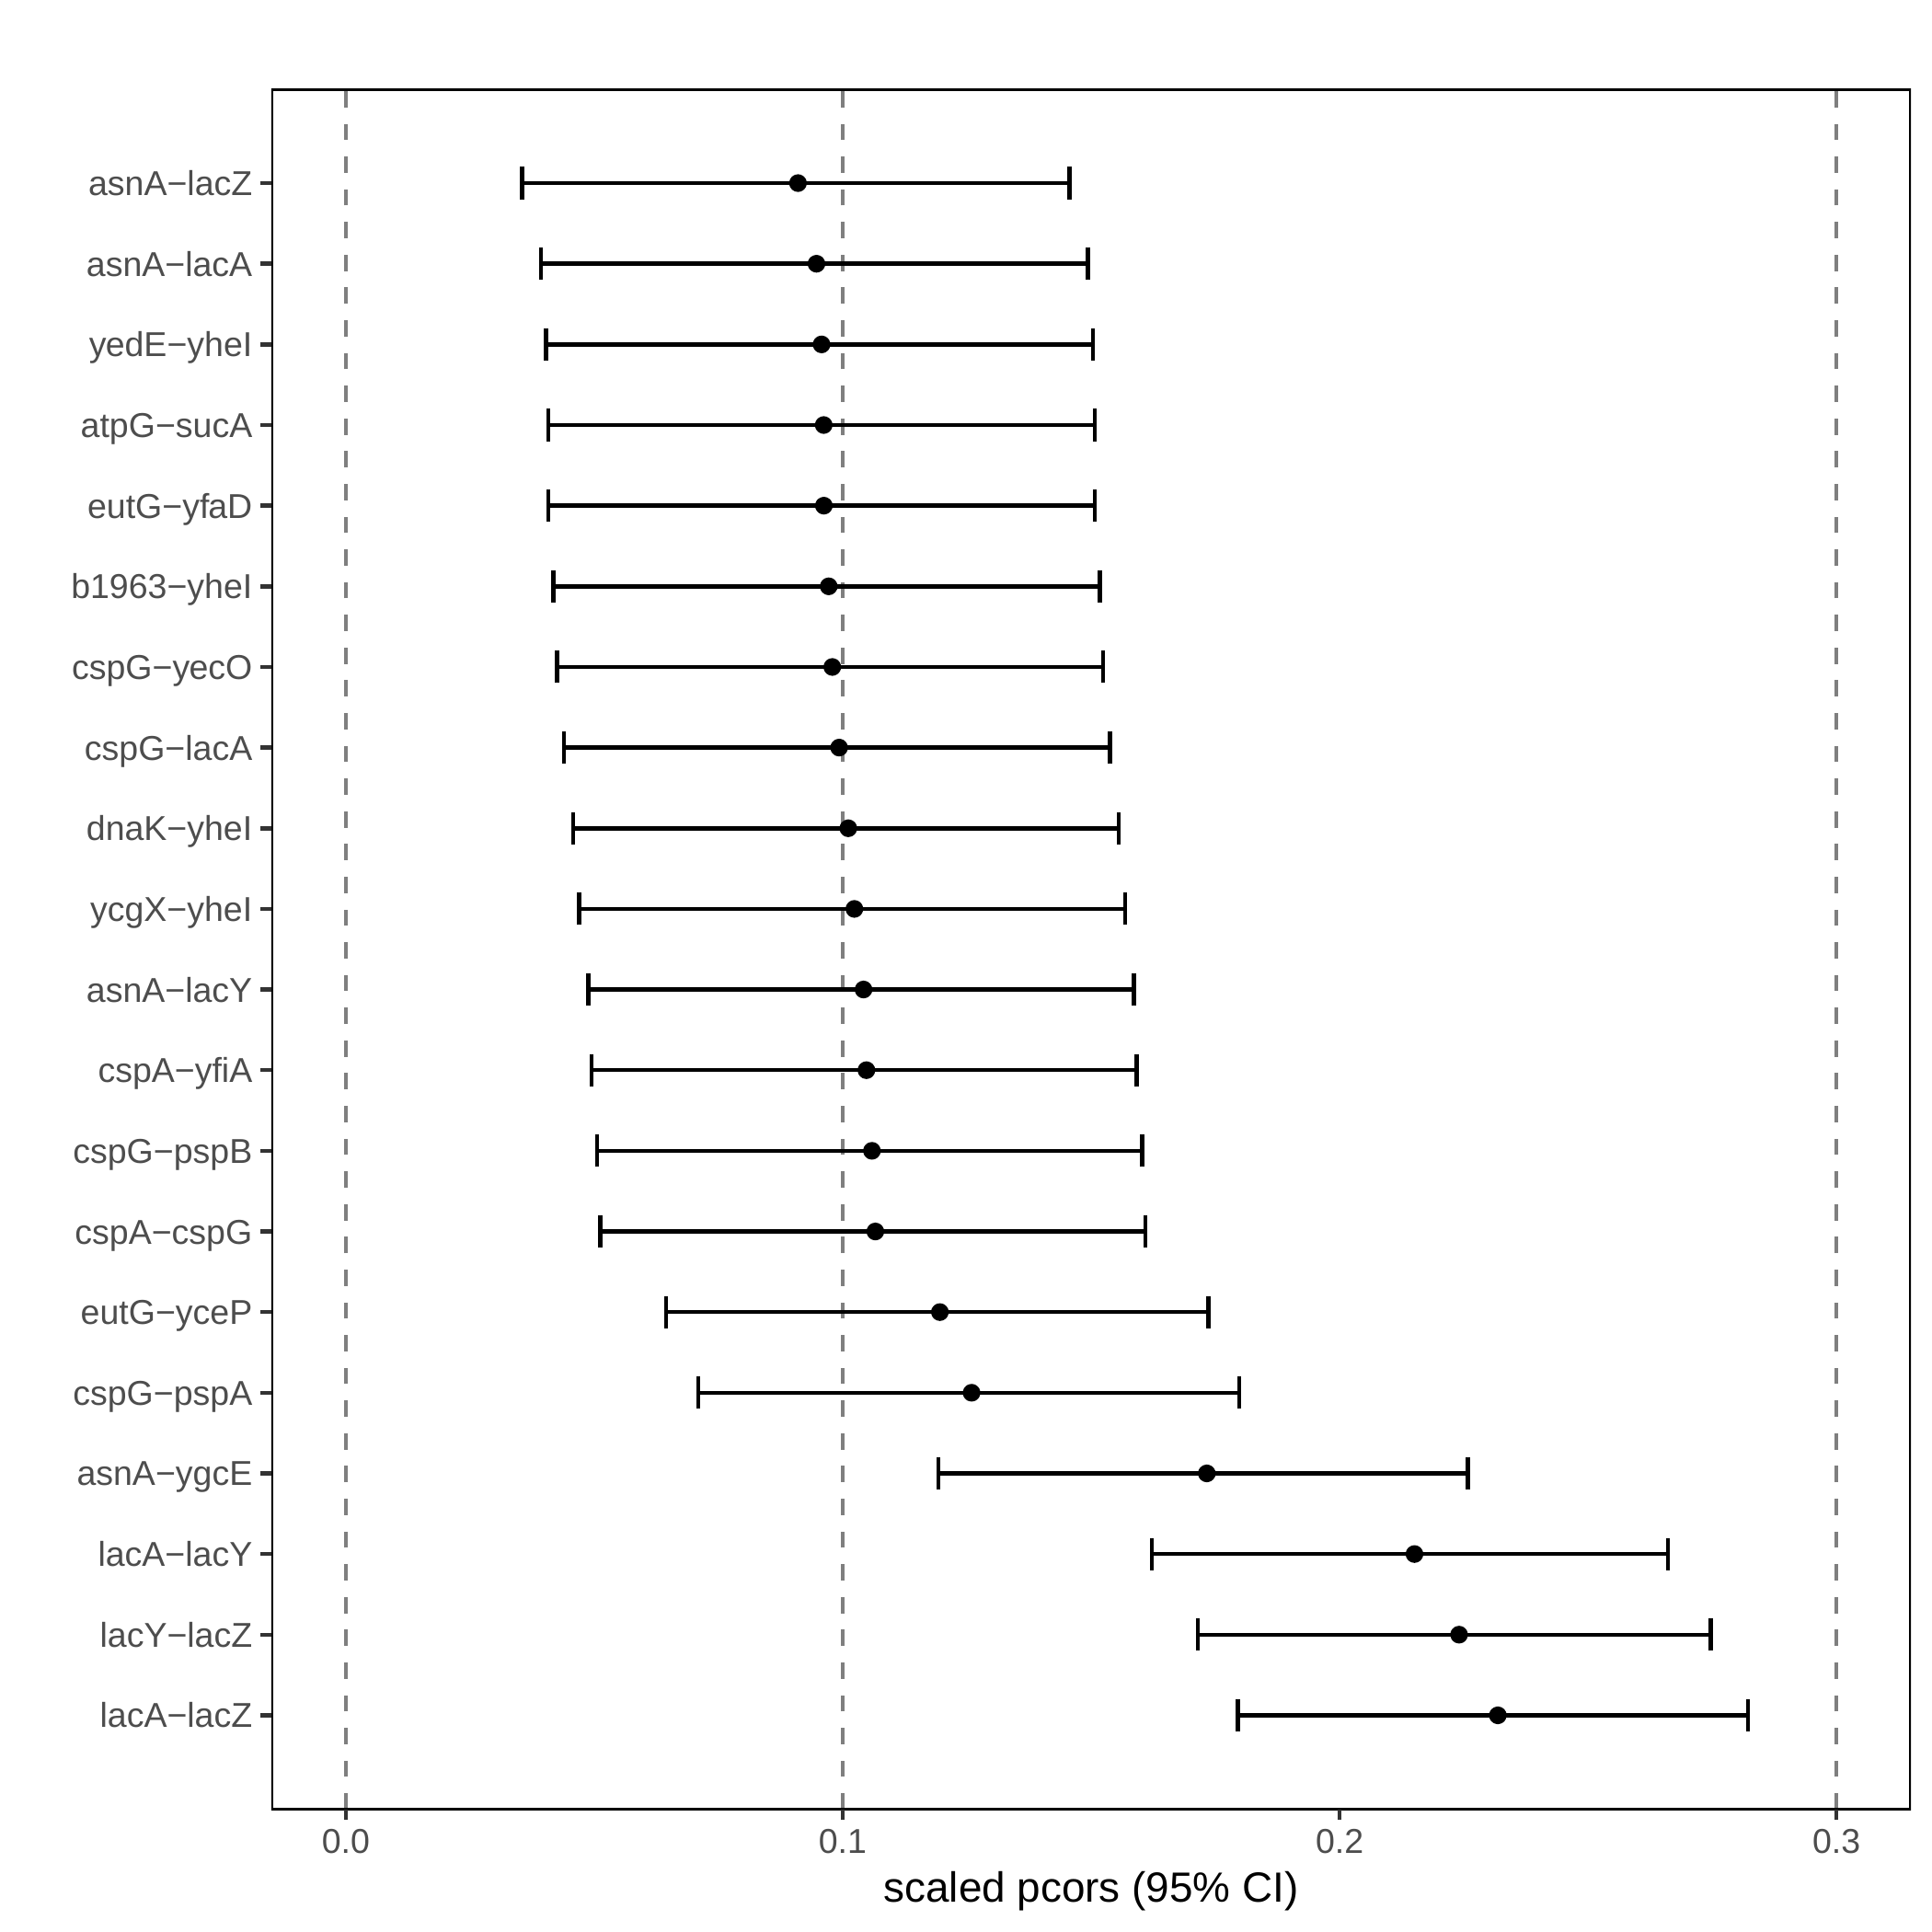
Escherichia coli. Forest plot of partial correlations. The 15 strongest edges are displayed with their 95% confidence intervals. The vertical lines show the 0.1 and 0.3 thresholds for weak and mild correlations (Cohen, 1988).#
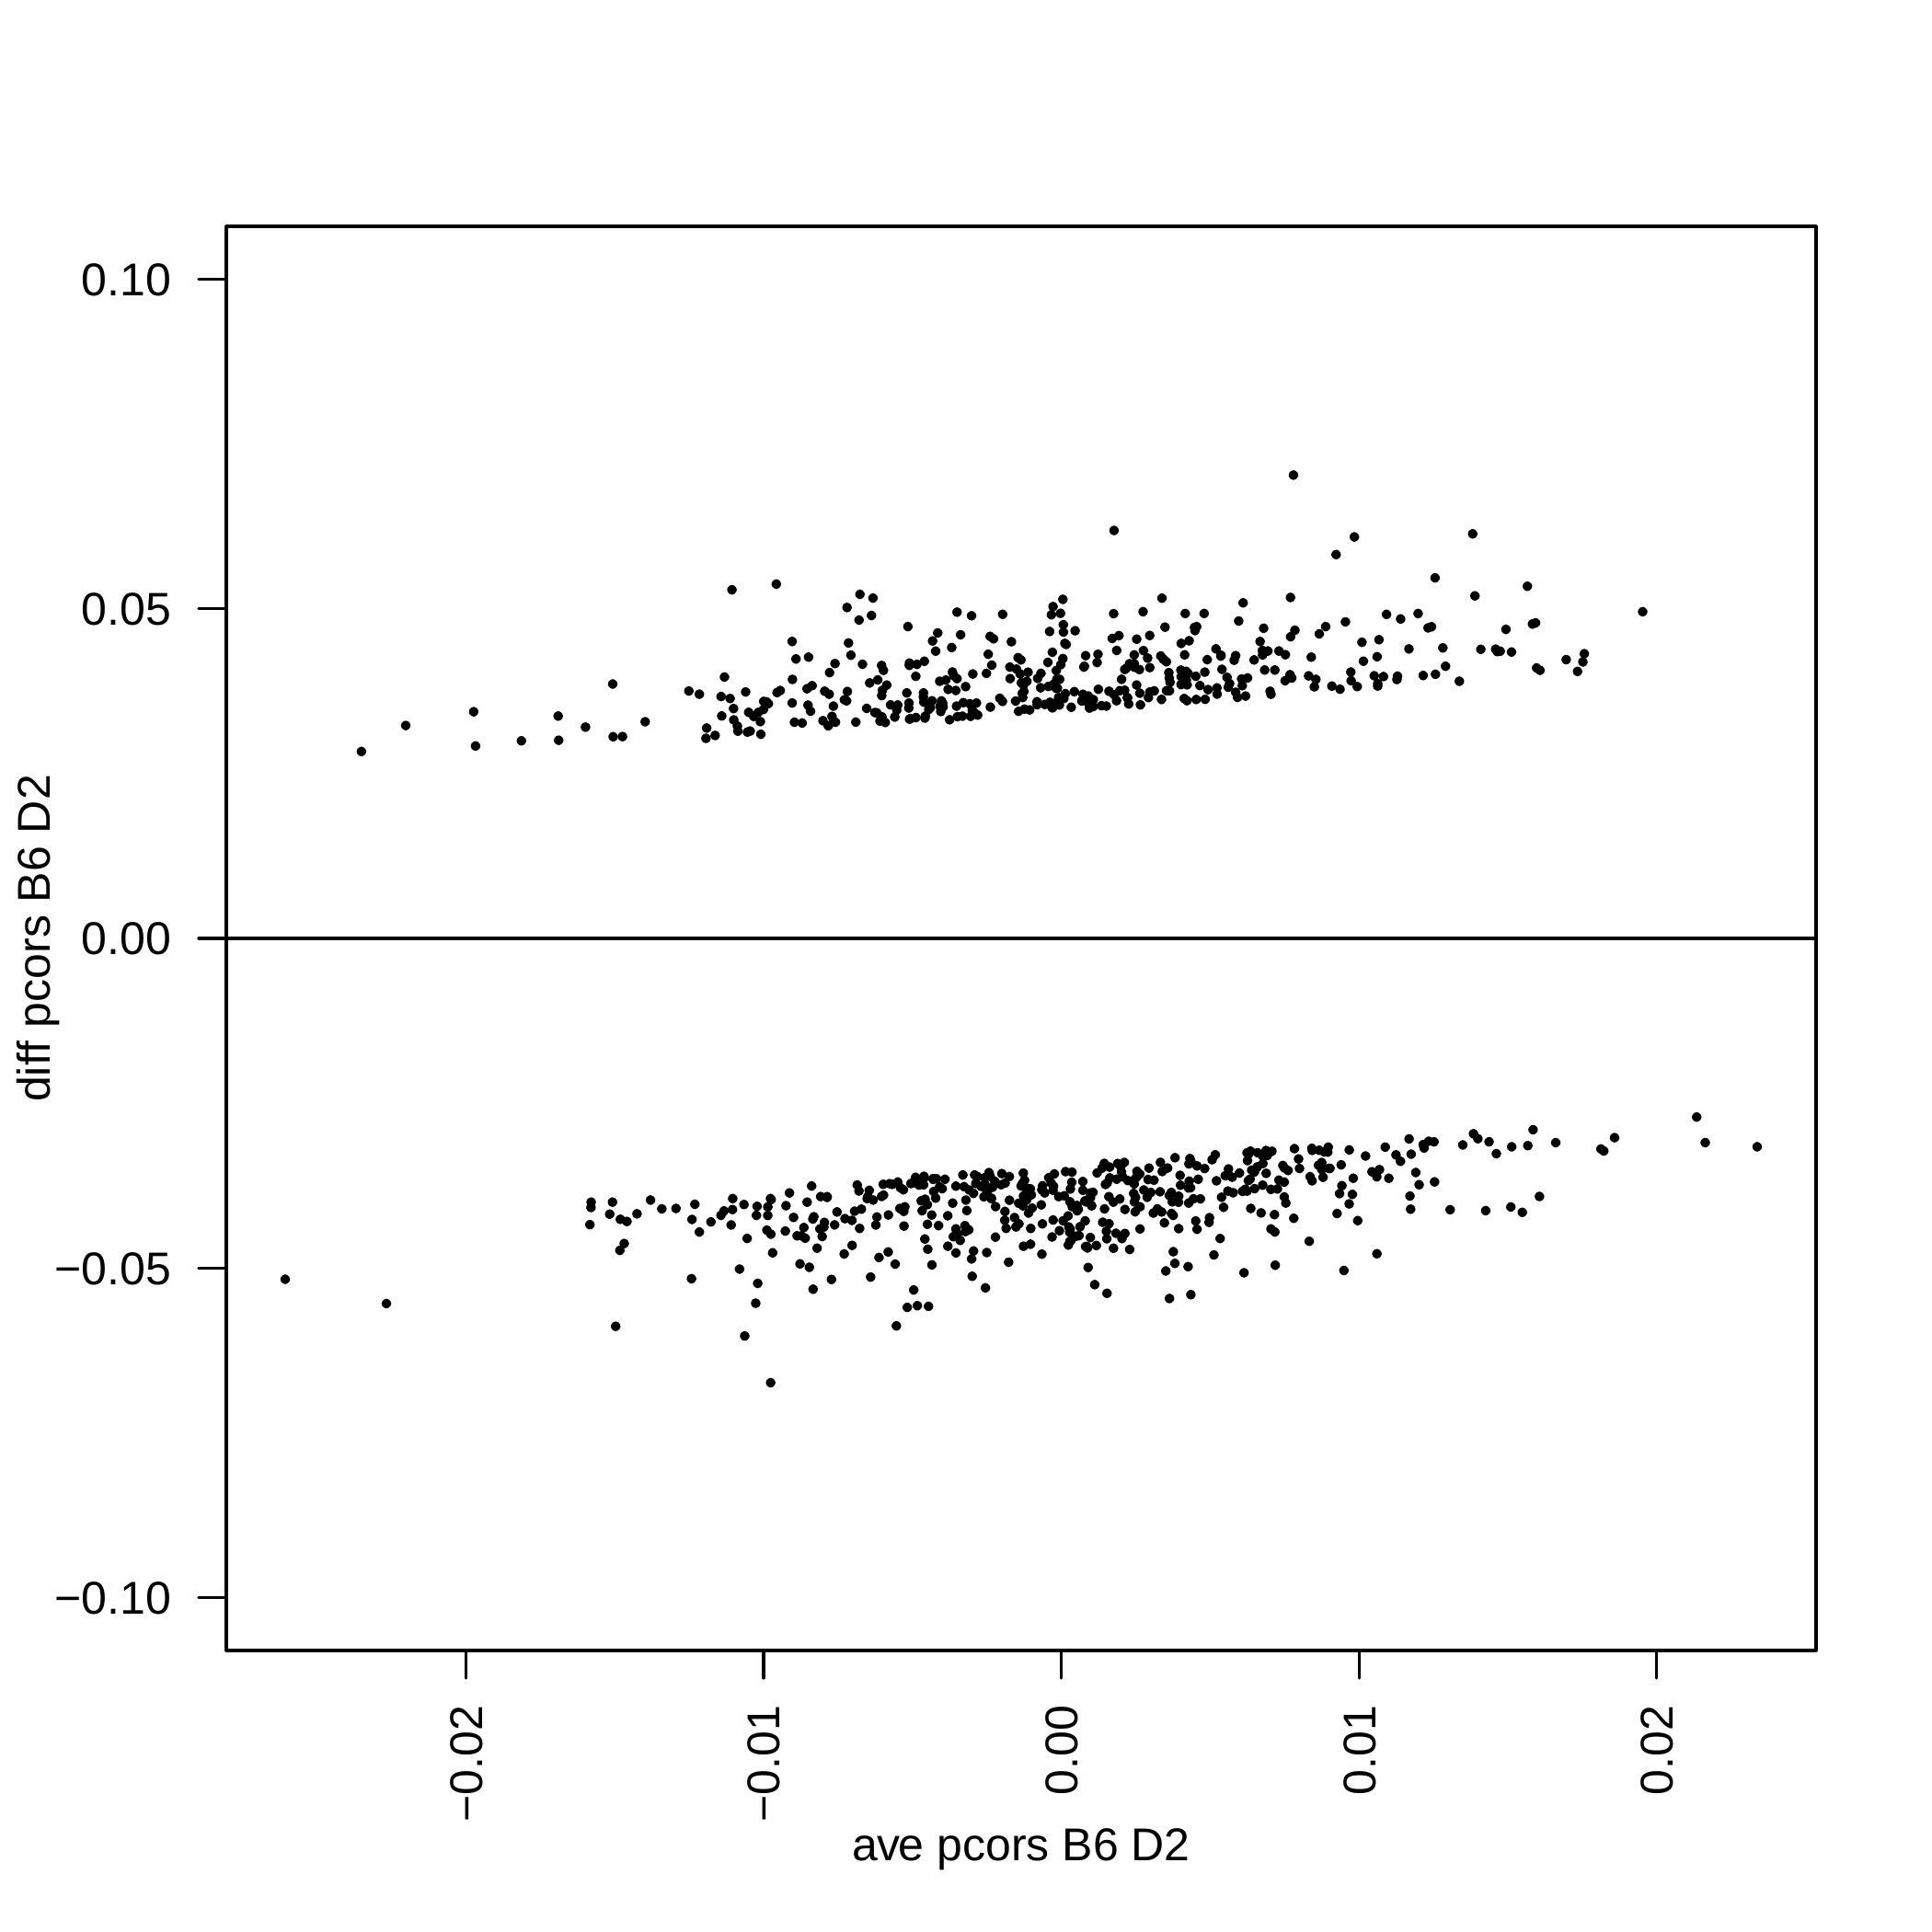
Figure 3. Differential network analysis#
Save the following JSON object in an
zscore.jsonfile{ "filename": "https://raw.githubusercontent.com/V-Bernal/GeneNetTools/venus/feature/container/GeneNetTools/tests/testthat/data/DBA_2J.csv", "filename2": "https://raw.githubusercontent.com/V-Bernal/GeneNetTools/venus/feature/container/GeneNetTools/tests/testthat/data/C57BL_6J.csv", "verbose": true, "cutoff": 0.01 }
or download the json file running the command:
wget https://raw.githubusercontent.com/V-Bernal/GeneNetTools/venus/feature/container/GeneNetTools/tests/testthat/params/zscore.json
Run the command
docker run --rm -v "$PWD":/app/data venustiano/cds:genenettools-0.1.0 c_zscore_shrunk zscore.json
Results
Opening  parameters file: zscore.json
Reading all columns
Reading all columns
Number of samples =  11
Number of variables =  221
degrees of freedom k = 465.630975024994
Number of samples =  10
Number of variables =  221
degrees of freedom k = 284.915155078846
Additional example#
Network for Escherichia coli microarray data Bernal et al. [BBG+19].
docker run --rm -v "$PWD":/app/data venustiano/cds:genenettools-0.1.0 c_pval_pcor_shrunk shrunk.json
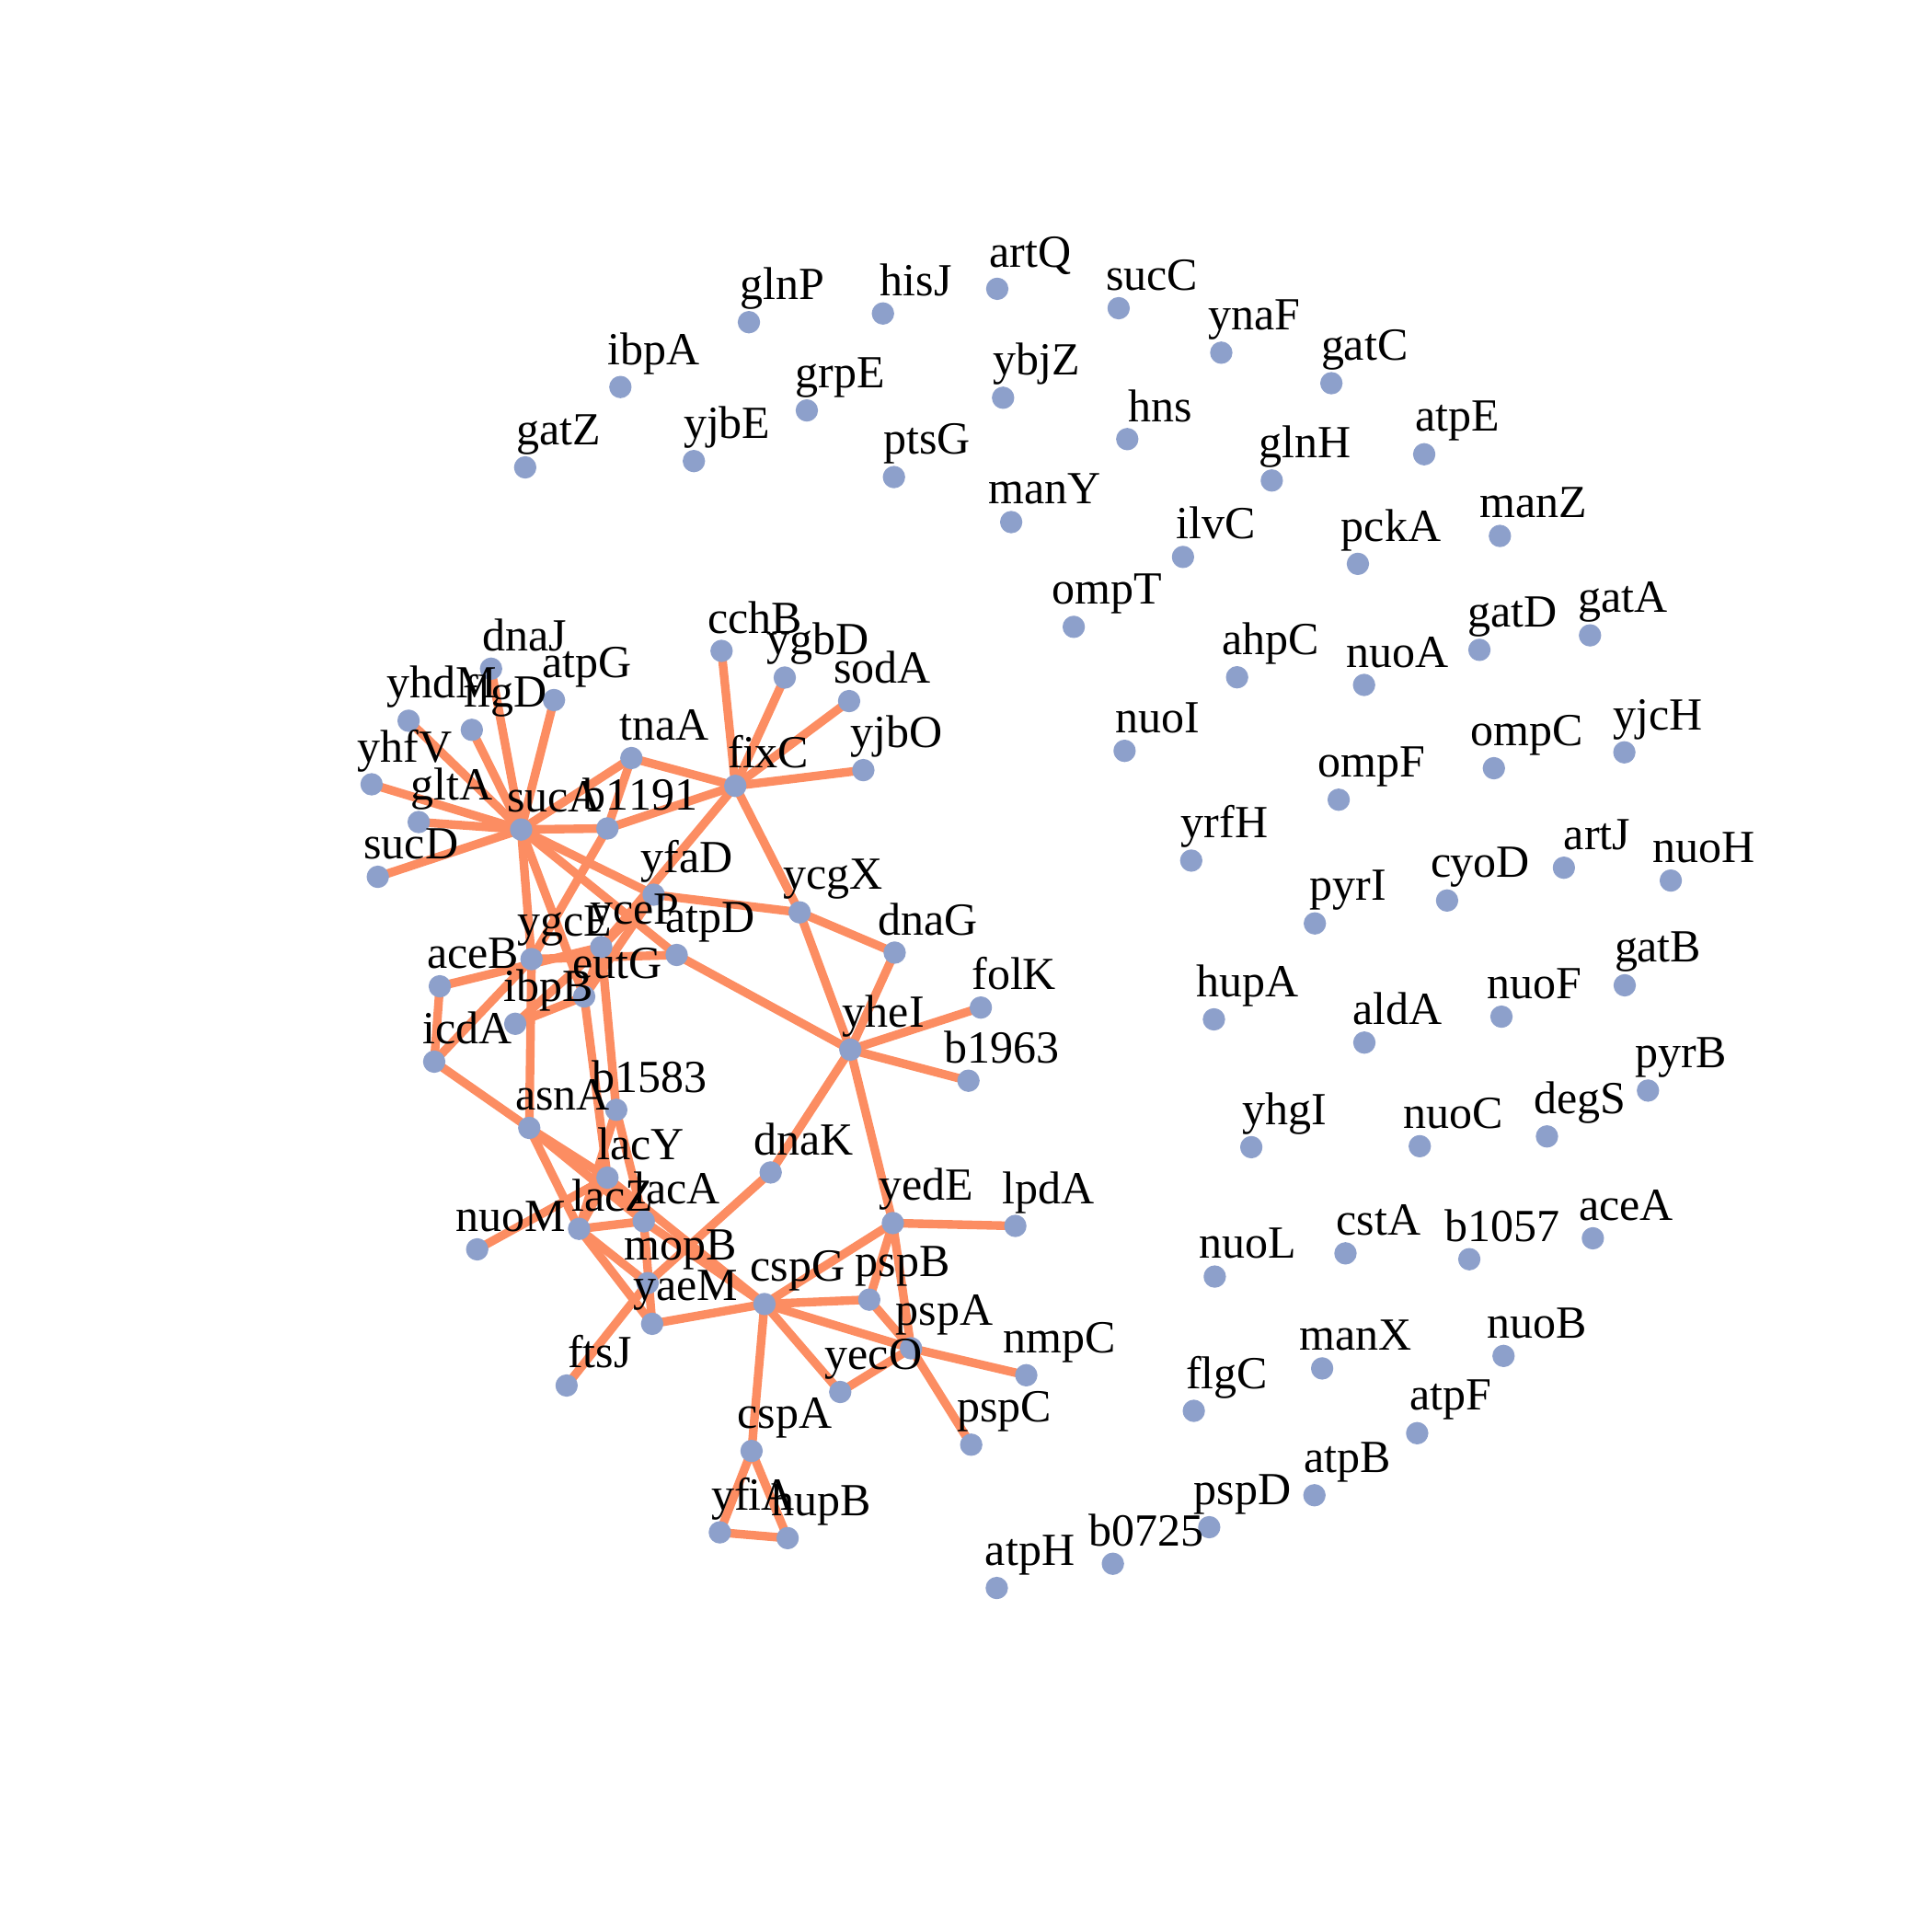
Figure S5-a. GGM structure for Escherichia coli. The figure displays the GGM structure for Escherichia coli for the connected genes with Shrunk MLE at 𝛼 = 0.01.#
Reusing the methods#
When using the methods with your own data, a couple of constraint are
that the variables/columns should be numeric and make sure that no
rownames are in the data file. The above examples retrieve the data
is retrieved from internet but it can be stored in the same folder as
the JSON file.
Basic commands#
Running the container:
docker run --rm venustiano/cds:genenettools-0.1.0
will display the available functions in the container:
Index:

c_pcor_shrunk           Partial correlation shrunk
c_pval_pcor_shrunk      pval_pcor_shrunk
c_zscore_shrunk         c_zscore_shrunk
compare.GGM             compare.GGM
The c_ prefix in the function name stands for containerized and receives a JSON file name as a parameter. This file must contain information such as the data file, the parameters of the function and the output formats. Finally, the container will stop running and the –rm flag will remove it.
Function documentation#
The help flag.
docker run --rm venustiano/cds:genenettools-0.1.0 c_pcor_shrunk help
c_pcor_shrunk          package:GeneNetTools           R Documentation

Partial correlation shrunk

Description:

  This function computes confidence intervals for the partial
  correlation with shrinkage.

Usage:

  c_pcor_shrunk(lparams)

Arguments:

lparams: a list of parameters created using a JSON file. This file should
         contain the following name/value pairs.

         "filename": <string, required>

         "variables": <array, strings representing column names>

         "cutoff": <number, required threshold for the p-value of the
         partial correlation>

         "verbose": <boolean, required to display detailed description
         on the terminal>

Value:

  Forest plot of partial correlations in Rplot.pdf
Citation#
Todo
Generate Zenodo DOI
GitHub#
If you want to use the original GeneNetTools source code or
install the R package, visit the main author’s GitHub repository.
References#
- BBG+19
Victor Bernal, Rainer Bischoff, Victor Guryev, Marco Grzegorczyk, and Peter Horvatovich. Exact hypothesis testing for shrinkage-based Gaussian graphical models. Bioinformatics, 35(23):5011–5017, 05 2019. URL: https://doi.org/10.1093/bioinformatics/btz357, arXiv:https://academic.oup.com/bioinformatics/article-pdf/35/23/5011/31278560/btz357.pdf, doi:10.1093/bioinformatics/btz357.
- BSAB+22
Victor Bernal, Venustiano Soancatl-Aguilar, Jonas Bulthuis, Victor Guryev, Peter Horvatovich, and Marco Grzegorczyk. GeneNetTools: tests for Gaussian graphical models with shrinkage. Bioinformatics, 09 2022. btac657. URL: https://doi.org/10.1093/bioinformatics/btac657, doi:10.1093/bioinformatics/btac657.