rugplot: Histograms
Contents
rugplot: Histograms#
A histogram is commonly used to visualize an approximation of the
distribution of one-dimensional continuos data. Here some examples are
given to show how to create histograms using the rugplot
container. The famous iris dataset, (Fisher, 1936) will be used
to create such examples. The dataset can be downloaded directly from
DataHub, by running
the following command
wget https://datahub.io/machine-learning/iris/r/iris.csv
Invoke-WebRequest https://datahub.io/machine-learning/iris/r/iris.csv -OutFile iris.csv
or by adding the link in the previous command to the JSON template that will be created in the second step to create the histogram.
Creating a histogram using the rugplot container#
For simplicity it is better to create an alias, see the
Docker commands section.
Step 1, create a rugplot histogram template
rugplot template -p histogramdocker run --rm -v "$PWD":/app/data -u $(id -u):$(id -g) venustiano/rugplot:0.1.0 \ template -p histogram
docker run --rm -v ${PWD}:/app/data venustiano/rugplot:0.1.0 `
template -p histogram
A
histogram_params.jsonfile will be created including some of the name/value pairs listed below:{ "description": "Parameters to create a histogram(s) using the 'rugplot' R package", "filename": "<filename path>", "variables": null, "aesthetics": { "y_variable": null, "x_variable": "<X required column name>", "fill": null, }, "labels": { "title": null, "subtitle": null, }, }
Step 2, add the
'data file','y variable'and the'title'values in the template:{ "filename": "https://datahub.io/machine-learning/iris/r/iris.csv", "aesthetics": { "x_variable": "sepallength", }, "labels": { "title": "Sepal length histogram", }, }
Step 3, create the histogram
rugplot plot -p histogram --file histogram_params.jsondocker run --rm -v "$PWD":/app/data -u $(id -u):$(id -g) venustiano/rugplot:0.1.0 \ plot -p histogram --file histogram_params.json
docker run --rm -v ${PWD}:/app/data venustiano/rugplot:0.1.0 `
plot -p histogram --file histogram_params.json
The result will be stored in the
Rplots.pdffile.
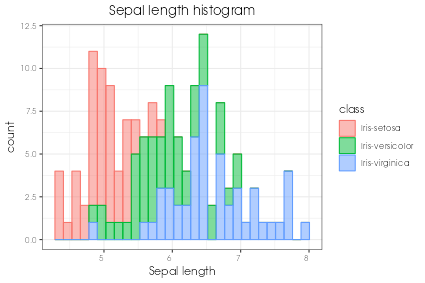
Customizing the histogram#
Different attributes can be customized such as other labels, colours
and file format. For example, adding the values below (to save space,
only the updated name/value are listed) in
histogram_params.json
"colour": "class",
"labels": {
    "x": "Sepal length",
},
"save": {
    "save": true,
    "outputfilename": "sepal-length_histogram.png",
    "device": "png",
}
and running the exactly same command in step 3 will produce the
following visualization stored in a png file.
The png file has the default size 10x15 cm (height/width) and 72
dots per inch. These properties can be changed in the "save"
attributes of the JSON file.
Other properties can also be added such as facets, interactive plots and LaTeX tikDevice plots.