rugplot: GUI
Contents
rugplot: GUI#
The rugplot GUI is a set of forms to facilitate a user friendly
interface to create reproducible visualizations using the rugplot R
package. Each of these forms display fields according to the
associated visualization technique. Based on the concept of The
Grammar of Graphics, these fields can represent elements such as
Aesthetics, Attributes or Facets. Currently, there are
five visualization techniques implemented: PCA, histograms,
heatmaps, scatterplots and violin plots.
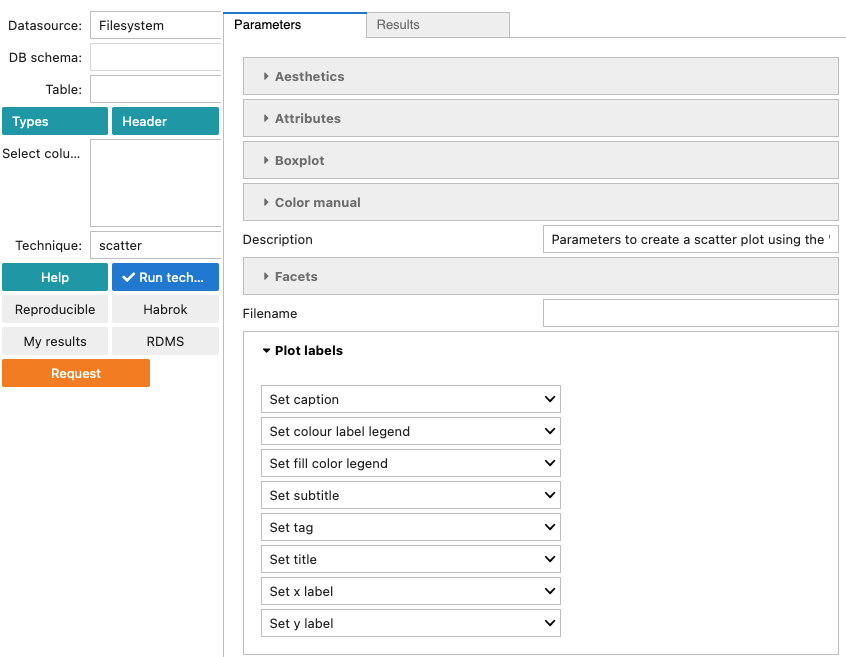
As an example, the following screenshot shows on the left panel, a csv file selected in the Table dropdown list. The Select column box shows three variables selected highlighted in blue. The Technique dropdown list shows that the scatter technique has been selected. On the right side panel, a foldable form associated with the scatter technique is displayed.
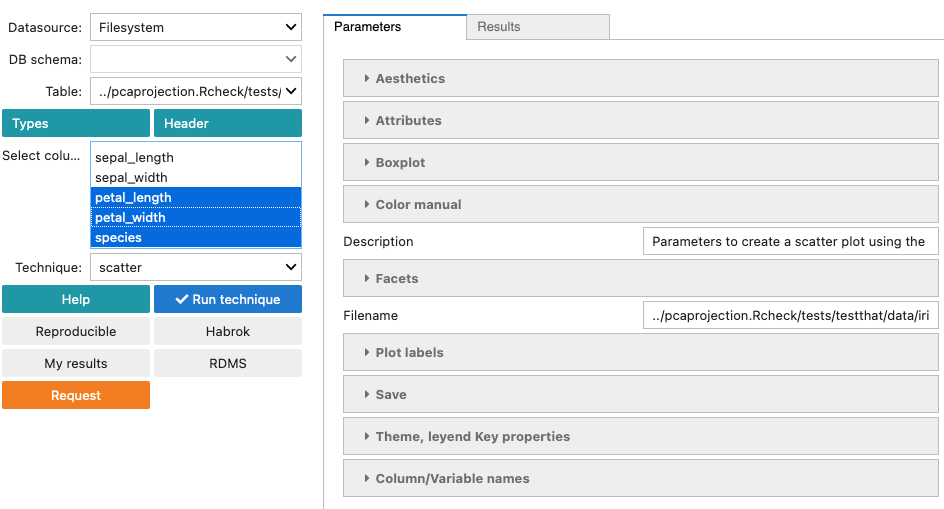
The sections of the scatter form are described in the following subsections.
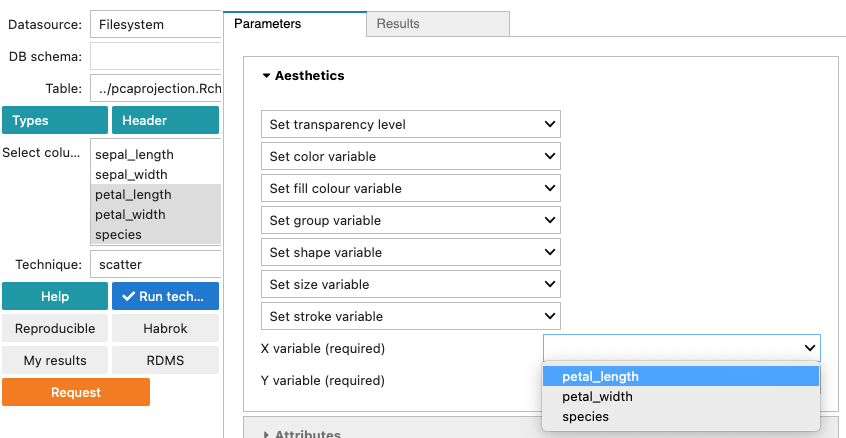
Aesthetics#
Aesthetics, are always represented by columns in the dataset and
can be categorical or numeric variables. These columns can chosen
from the selected variables on the left panel. Aesthetics can be
different for each visualization technique, most of them are
optional and the required variables (aesthetics) are indicated as
shown below.
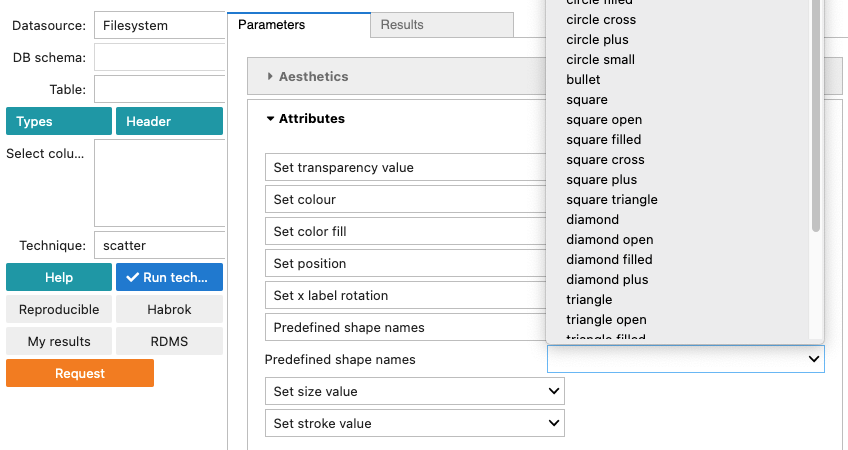
Attributes#
Attributes, always represent constant values such as numbers or
strings. For example, numbers can represent point size, angles or
transparency levels. Strings can represent hexadecimal colors or
shapes like in the screenshot below.
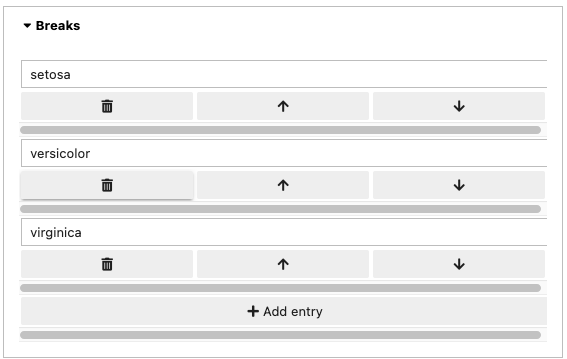
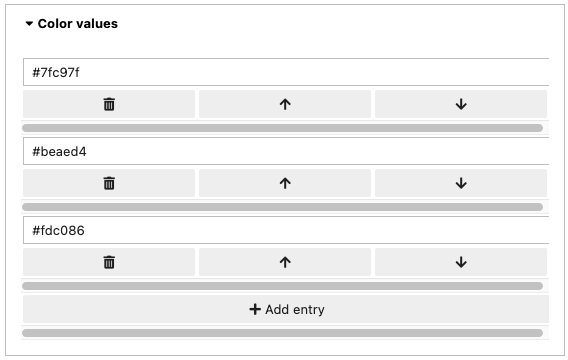
Color manual#
The Color manual section in the form is implemented only for
categorical variables. The categorical variable must be provided in
the colour field, aesthetics section. Three vectors must be provided,
Breaks, Labels and Color values.
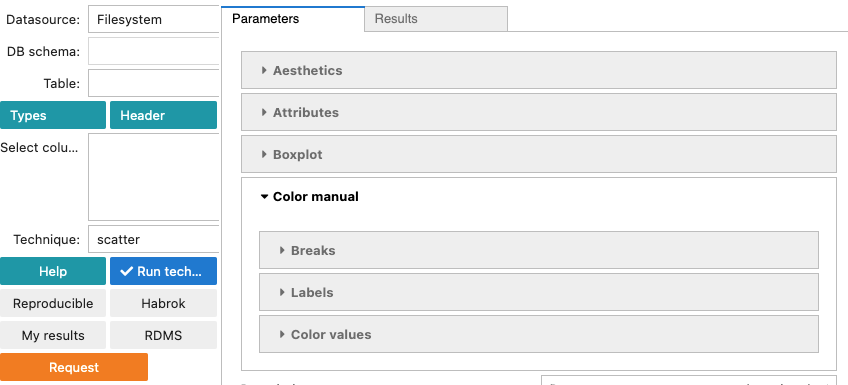
Breaks are the
categories in the categorical variable. Labels are the labels to
be displayed in the legend and color values are the colors for
each of the categories. The colors can be in hexadecimal format or in
a string format as returned by the colors() function in R. The
length of the vectors must be equal to the number of categories in the
variable.
For example, the following screenshots show how to assign colors
manually to a scatterplot using the iris dataset and the
categorical variable species.

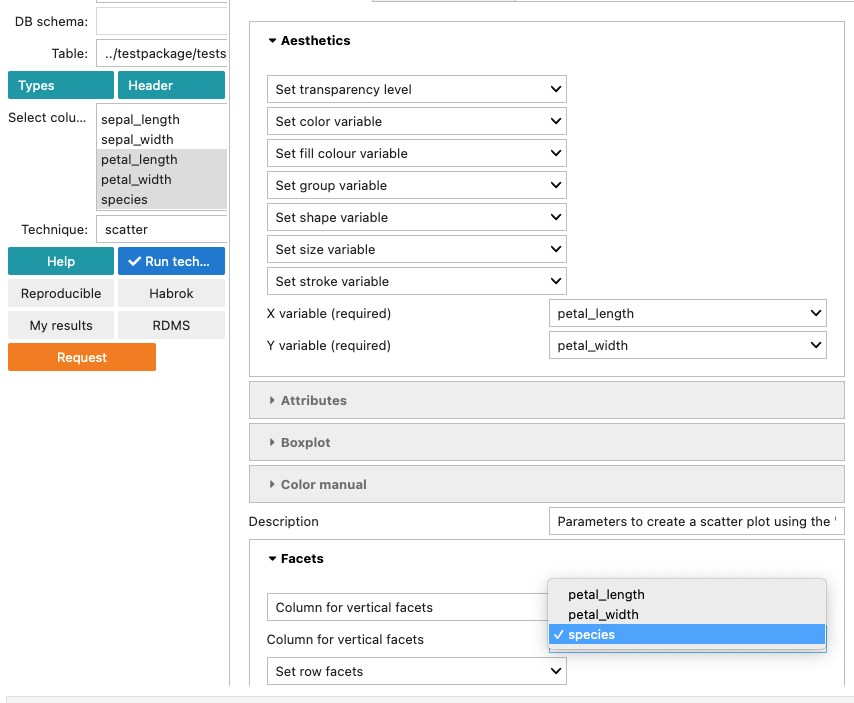
Facets#
Facets, splits a plot into a matrix of panels. This implementation
is based on the facet_grid() function
from the ggplot2 R package. Currently, in the rugplot
implementation can be used with one or two discrete variables. For
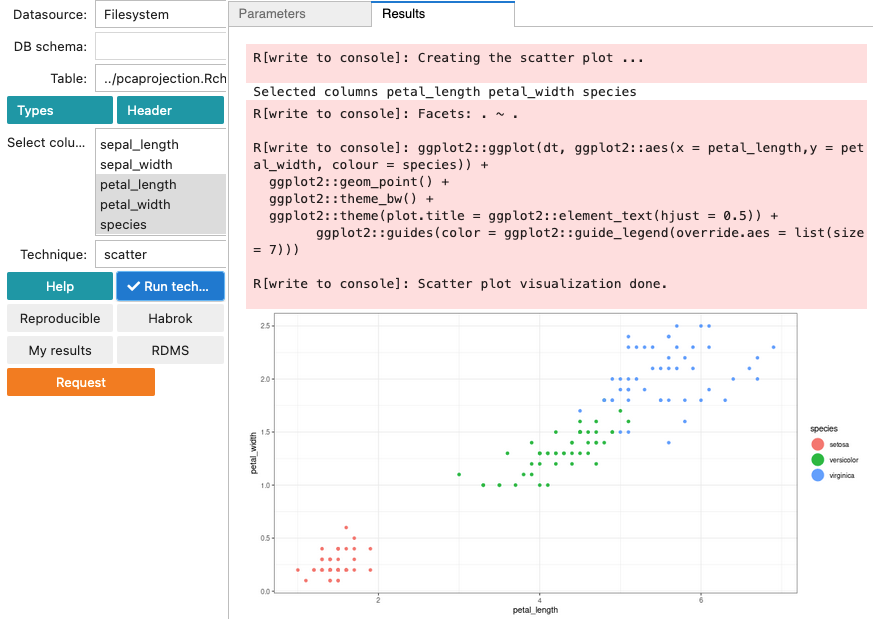
example, the following screenshot shows how to use vertical facets
to create scatterplot panels using the species variable from the
iris dataset.
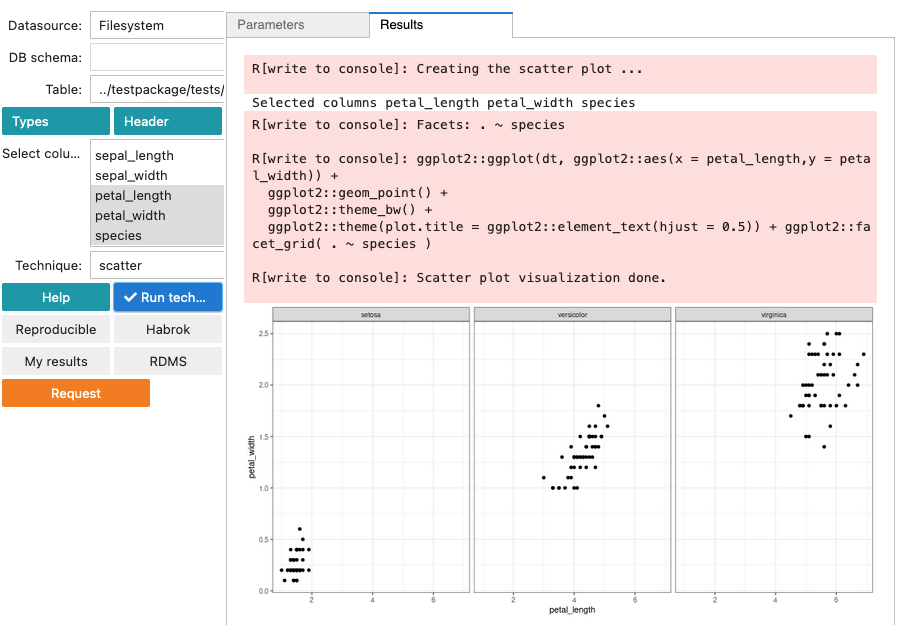
The result of using vertical facets is shown in the screenshot below.
Plot labels#
The Plot labels section allows to set different labels in a plot
such as title, subtitle and coordinate labels.
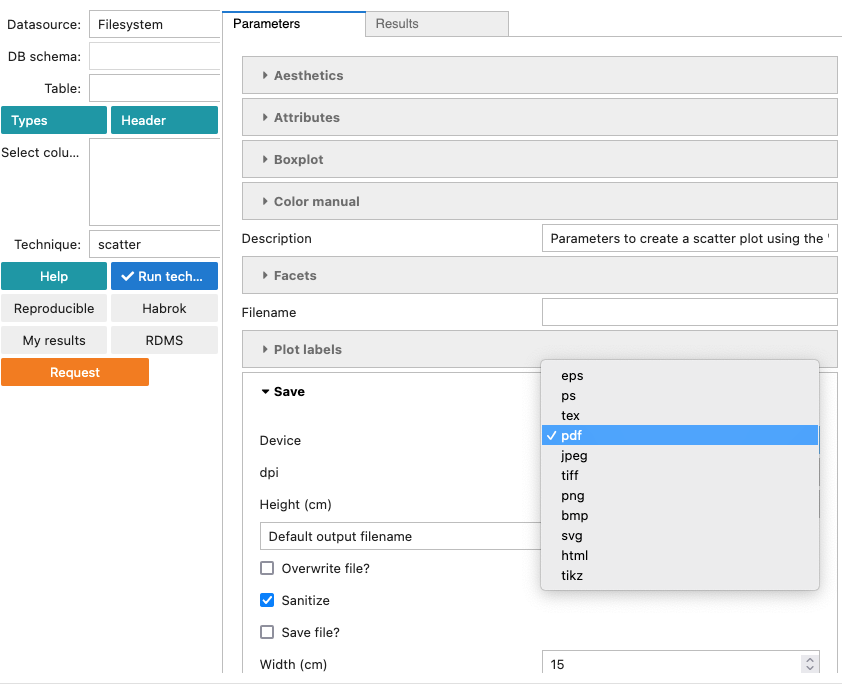
Save#
The Save section has a number of features to save the
visualizations in different formats such as png, jpeg, pdf and
html. Two interesting formats are html and tikz. The former
option produces an interactive plot using the plotly package and
the latter produces a high quality plot in pdf using the
TikzDevice R package which generates the plots using
LaTeX. Additionally, dimensions (height and width) and resolution
of the output (for non vector-graphics formats such as png and jpeg)
can be defined. Finally, the Sanitize flag is only used for tikz
plots to escape special LaTeX symbols.
Theme, leyend Key properties#
The Theme, leyend Key properties section is meant to customize the
non-data elements of the plots, for example, titles, fonts and
legends. Currently, only the key-size of the legend is
implemented. The effect of setting the size of the key to 7 is shown
in the following screenshot.
Column/Variable names#
This section provides the columns to be used to create the visualization. In the rugplot:GUI version, these columns are taken automatically from the selected columns on the left panel.
Visualization techniques: