rugplot: scatterplots
Contents
rugplot: scatterplots#
Quickstart#
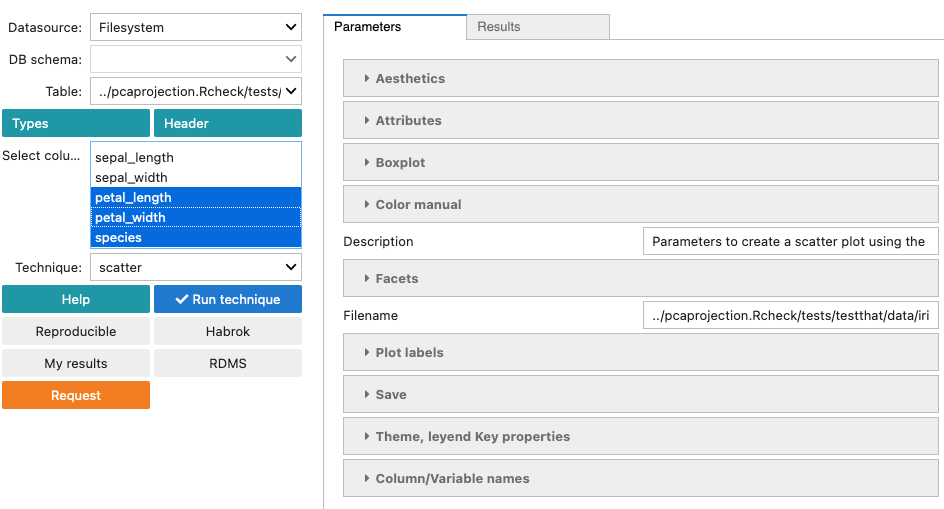
Select a csv file in the Table dropdown list, select the columns
to create the scatter plot in the Select columns box and select
scatter in the Technique drop down list. In the screenshot
below, the iris.csv file has been selected and three variables. The
scatter form is displayed on the right-side panel.
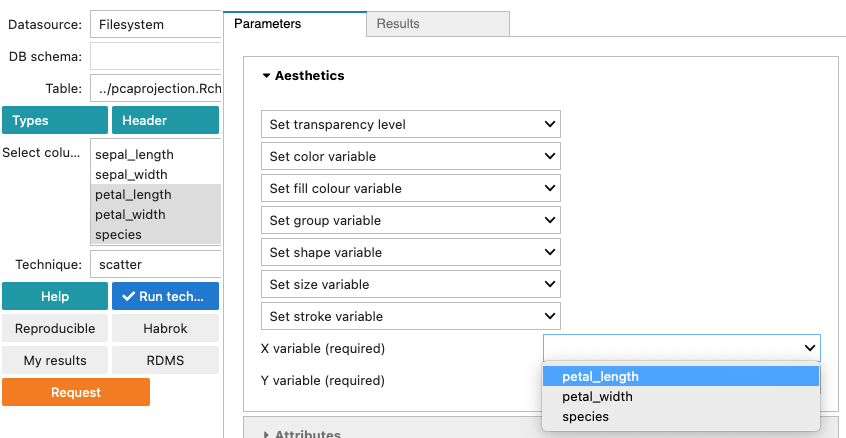
To create a scatterplot two parameters in the aesthetics section
must be provided, x and y.
Finally, running the technique by clicking on the Run technique
button will produce a scatterplot.
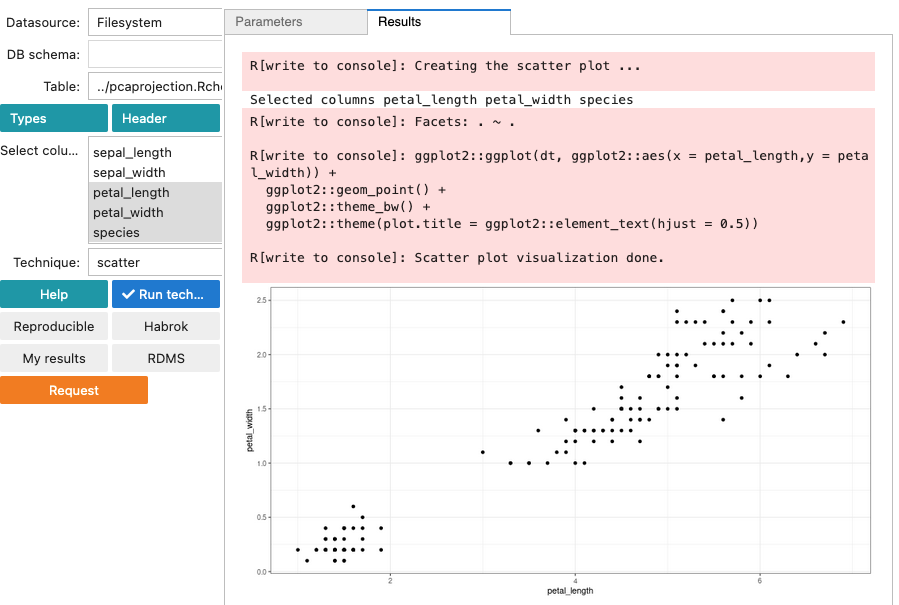
The results tab shows the R source code used to generate the plot.
Additional documentation#
The other fields in the form are optional. In particular, to create
the scatterplots, the geom_point() function
from ggplot2 is used. Thus, the Aestethics fields are based on the
aesthetics
that geom_point accepts. The aesthetic specifications can be found in
the cran
or tidyverse
documentation.
Generic descriptions of the different sections of the form such as
Aesthetics, Attributes, Color manual, Facets, Plot
labels, Save, Theme, legend Key properties and
Column/Variable names can be found in the
section.