rugplot: Violin Plots
Contents
rugplot: Violin Plots#
Similar to histograms, violin plos are used to visualize an
approximation of the distribution of one-dimensional continuos
data. However, instead of showing bars, violin plots adjust a
probability density function to fit a curve on the histogram, then the
curve is rotated 90 degrees and finally reflected. Here we show how to
create violin plots using the rugplot container. The famous Auto
Imports Database, (Jeffrey, 1936) will be used, such dataset can
be downloaded directly from DataHub autos, by running the
following command
wget https://datahub.io/machine-learning/autos/r/autos.csv
Invoke-WebRequest https://datahub.io/machine-learning/autos/r/autos.csv -OutFile autos.csv
or by adding the link in the previous command to the JSON template that will be created in the second step to create the histogram.
Creating violin plots using the rugplot container#
An alias can hide the length of the command, see the
Docker commands section, but copying the raw command or
PowerShell is also easy.
Step 1, create a rugplot violin` JSON template
rugplot template -p violindocker run --rm -v "$PWD":/app/data -u $(id -u):$(id -g) venustiano/rugplot:0.1.0 \ template -p violin
docker run --rm -v ${PWD}:/app/data venustiano/rugplot:0.1.0 `
template -p violin
A
violin_params.jsonfile will be created including some of the name/value pairs listed below:{ "description": "Parameters to create violin plots using the 'rugplot' R package", "filename": "<filename path>", "aesthetics": { "y_variable": "<Y required column name>", "x_variable": "''", "fill": null, "colour": null, }, "boxplot": { "addboxplot": false, }, "rotxlabs": 0, "save": { "save": false, "dpi": 72, "device": "pdf", } }
Step 2, add the values below to the
violin_params.jsonfile:{ "description": "Parameters to create violin plots using the 'rugplot' R package", "filename": "https://datahub.io/machine-learning/autos/r/autos.csv", "aesthetics": { "y_variable": "highway-mpg", "x_variable": "body-style", "colour": "body-style", "fill": "body-style", }, "boxplot": { "addboxplot": true, }, "rotxlabs": 45, "save": { "save": true, "dpi": 300, "device": "png", } }
Step 3, create the violin plots
rugplot plot -p violin --file violin_params.jsondocker run --rm -v "$PWD":/app/data -u $(id -u):$(id -g) venustiano/rugplot:0.1.0 \ plot -p violin --file violin_params.json
docker run --rm -v ${PWD}:/app/data venustiano/rugplot:0.1.0 `
plot -p violin --file violin_params.json
The result as follows
Error
Error in ggplot2::geom_violin():
! Problem while computing aesthetics.
ℹ Error occurred in the 1st layer.
Note
Special characters such as
"-"may cause ggplot2 to break. In this case the easiest solution is to rename the column nameshighway-mpgandbody_styletohighwaympgandbodystylein theautos.csvfile.After changing the column names in the
autos.csvfile, updating the JSON file as follows{ "filename": "autos.csv", "aesthetics": { "y_variable": "highwaympg", "x_variable": "bodystyle", "fill": "bodystyle", "colour": "bodystyle", }, }
and running the command in step 3 a png file with name like
autos.csv-violin-20230203_121603.366.pngwill be saved.
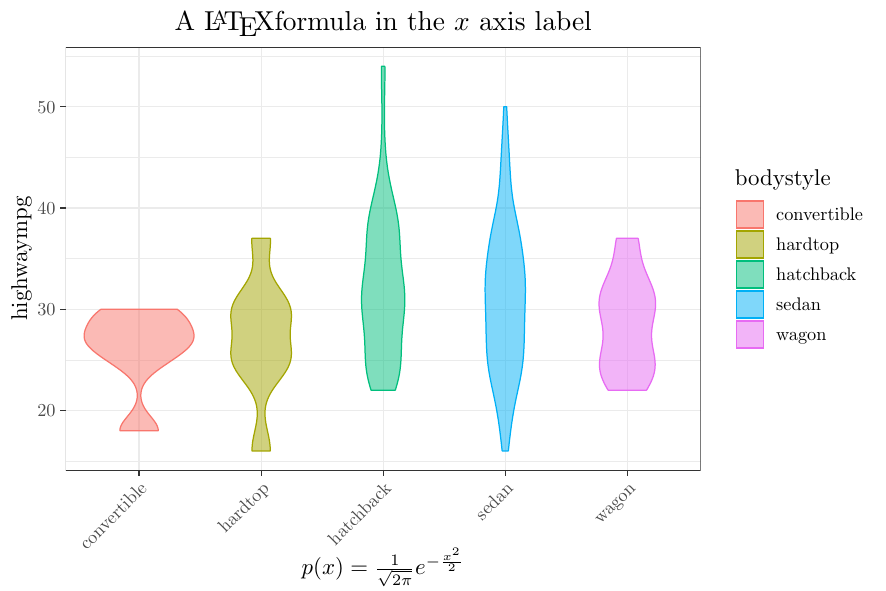
A last example in this section is the creation of tikz LaTeX quality plots
including a LaTeX formula, using the tikzDevice R package. The
tikz version of the previous looks as follows:
The changes to the JSON template are the following:
{
     "labels": {
         "title": "A \\\\\\\\LaTeX formula in the $x$ axis label",
         "x": "$p(x)=\\\\\\\\frac{1}{\\\\\\\\sqrt{2\\\\\\\\pi}}e^{-\\\\\\\\frac{x^2}{2}}$",
     }
    "save": {
        "device": "tikz",
        "sanitize": false
    }
}
and finally, run the command in step 3 again.
Note
LaTeX commands have to be escaped using eight backslashes and
the "sanitize" property must be set to false. However, in
axis breaks only four backslashes are needed, see the heatmap
example.