rugplot: PCA Projections
Contents
rugplot: PCA Projections#
A popular technique to visualize the result of Principal Component
Analysis (PCA) is by means of projections where data with m
columns or variables are projected into a subpace with fewer columns,
typically 2. Here it is shown how to create PCA projections using the
rugplot container.
The famous iris dataset, (Fisher, 1936) will be used to create
such examples. The dataset can be downloaded from different sources
and in different ways, three of them are: first, visiting DataHub, second by running the
following command
wget https://datahub.io/machine-learning/iris/r/iris.csv
Invoke-WebRequest https://datahub.io/machine-learning/iris/r/iris.csv -OutFile iris.csv
and third, by adding the link in the previous command to the JSON template that will be created in the second step for creating a PCA projection.
Creating a PCA projection plot using the rugplot container#
For simplicity it is better to create an alias, see the
Docker commands section.
Step 1, create a rugplot PCA projection template
rugplot template --plot pcadocker run --rm -v "$PWD":/app/data -u $(id -u):$(id -g) venustiano/rugplot:0.1.0 \ template --plot pca
docker run --rm -v ${PWD}:/app/data venustiano/rugplot:0.1.0 `
template --plot pca
A
pca_projection_params.jsonfile will be created including some of the name/value pairs listed below:{ "description": "Parameters for a PCA projection using the 'rugplot' R package", "filename": "<filename path>", "colour": null, "labels": { "title": null, }, "save": { "save": false, "outputfilename": null, "device": "pdf", } }
Step 2, add the
'data file','colour'and the'title'values in the template:{ "filename": "https://datahub.io/machine-learning/iris/r/iris.csv", "colour": "class", "labels": { "title": "Iris PCA projection", }, "save": { "save": true, "outputfilename": "iris-pca.png", "device": "png", } }
Step 3, create the PCA projection plot
rugplot plot --plot pca --file pca_projection_params.jsondocker run --rm -v "$PWD":/app/data -u $(id -u):$(id -g) venustiano/rugplot:0.1.0 \ plot --plot pca --file pca_projection_params.json
docker run --rm -v ${PWD}:/app/data venustiano/rugplot:0.1.0 `
plot --plot pca --file pca_projection_params.json
The result will be stored in the
Rplots.pdffile.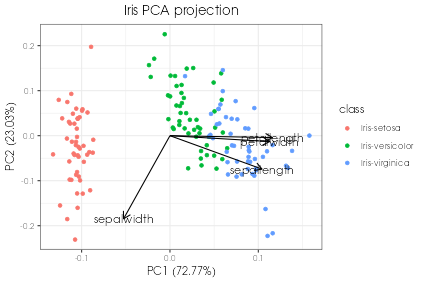
Interactive plots using plotly
Interactive plot#{ "labels": { "title": "Interactive iris PCA projection", }, "save": { "outputfilename": "iris-pca.html", "device": "html", } }The result